
A power semiconductor is not described adequately by its voltage and current ratings. A converter designer also needs to know how it conducts, how it switches, how its heat reaches the cooling system, and how those behaviours change with repeated stress.
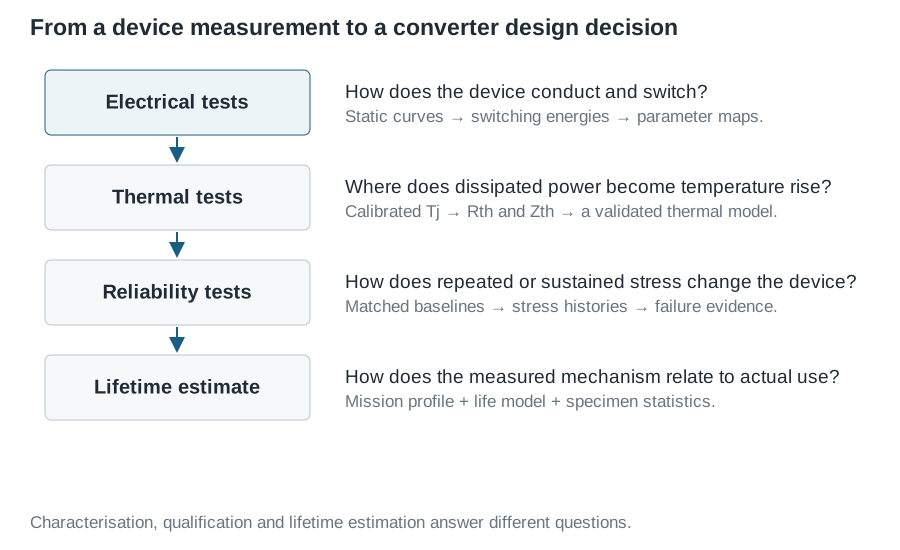
This series connects three questions: what does the device do now, how hot does it become, and how does it change over time? Each measurement has a defined stimulus, a measured response and an interpretation. Keeping these three separate makes the resulting model useful and the conclusions defensible.
The articles are professional teaching drafts, with illustrative calculations rather than claimed laboratory results. They explain how to plan and analyse tests; they do not constitute a device-specific qualification programme or a verified high-energy test fixture. All articles are signed by Dr. Fulong Li.
1. Distinguish characterisation, qualification and life prediction
Characterisation measures behaviour over a stated operating domain. For example, a resistance map may depend on junction temperature, current and gate voltage:
\[R_{\mathrm{DS(on)}}=f(T_j,I_D,V_{GS},\text{bias history},\text{measurement time}). \tag{1}\]Qualification evaluates a defined population against a specified stress programme and acceptance criteria. A passing result has the scope of that programme. The AEC document catalogue, for example, identifies AEC-Q101 as qualification for discrete semiconductors; other device and assembly classes have different documents.
Lifetime estimation combines operating stresses with a failure-mechanism model and statistical evidence. It is not obtained by converting a qualification test’s hours directly into field years.
Choose a device technology and package before planning the matrix. Silicon MOSFETs, IGBTs, SiC MOSFETs and GaN devices have different conduction, reverse-current, gate and ageing behaviours. Module interconnects also introduce failure mechanisms that may differ from those of discrete packages.
2. Electrical characterisation: the test inventory
| Test family | What to measure | Why it matters | Detailed tutorial |
|---|---|---|---|
| Static conduction | Output and transfer curves; on-resistance or saturation voltage; forward/reverse conduction | Conduction loss, gate-drive choice, parameter spread | Static electrical tests |
| Threshold and blocking | Threshold under a stated criterion, off-state and gate leakage, blocking behaviour under compliance | Device baseline, drift and insulation-related behaviour | Static electrical tests |
| Dynamic switching | Turn-on/off energy, slew rates, overshoot, reverse recovery and false turn-on | Switching-loss maps and commutation design | Double-pulse testing |
| Charge and capacitance | Gate charge, terminal capacitances, output charge/energy | Driver demand, switching trajectories and resonant commutation | Charge and capacitance |
| History-dependent conduction | Dynamic on-resistance with specified off-state stress and sensing delay | Trapping effects and realistic WBG conduction loss | Dynamic on-resistance |
| Abnormal-event robustness | SOA, avalanche/UIS where supported, short-circuit response and protection timing | Defined fault boundaries and protection design | Robustness testing |
A DPT result describes the DUT within a particular commutation circuit. Changing the opposing switch, gate resistor, layout or initial temperature can change the measured energy even if the DUT is unchanged. Preserve those conditions with the result.
3. Thermal characterisation: measure temperature before fitting a model
| Test family | Required information | Detailed tutorial |
|---|---|---|
| Junction-temperature measurement | TSEP calibration, sensing current, electrical settling, sensing delay; comparison with surface measurements | Junction temperature |
| Steady-state resistance | Dissipated power, junction and reference temperatures, heat-flow path and mounting boundary | Thermal resistance |
| Transient impedance | Heating/cooling histories, sampling window, boundary conditions, fitted time constants and validation pulses | Transient thermal impedance |
| Interface and multi-die effects | TIM/contact repeatability, shared cooling and cross-heating between dies | Resistance and transient models |
Steady thermal resistance describes the final temperature rise under specified conditions. Thermal impedance describes how that rise develops. Both depend on the heat-flow boundary; a package-top temperature is not automatically junction temperature.
4. Reliability and lifespan: choose the stress for the mechanism
| Test family | Dominant question | Detailed tutorial |
|---|---|---|
| Active power cycling | What repeated self-heating does to die attach, interconnects and packaging | Power cycling |
| Passive temperature cycling | What externally imposed temperature excursions do to assembled materials and joints | Temperature cycling |
| High-temperature electrical bias | Blocking, gate dielectric and electrically activated degradation under specified bias | Bias and humidity stresses |
| Humidity with/without bias | Moisture-related leakage, corrosion and insulation degradation | Bias and humidity stresses |
| Statistical life assessment | Failure distribution, censored samples, stress acceleration and mission-profile damage | Lifetime estimation |
Each linked chapter defines a coherent test family; closely related parameters are kept together so that fixture, calibration and interpretation can be understood in context. Mechanical vibration, shock, ESD and application-specific environmental tests may also be required. They need separate methods and are outside the present detailed tutorials.
5. Build the measurement plan before applying stress
Start with the decision the data must support: comparing gate resistors, selecting a cooling path, identifying model parameters or validating a reliability hypothesis. Then define the measurable quantity and acceptable uncertainty.
| Record | Minimum content |
|---|---|
| Device | Manufacturer/part, package, sample and lot identifiers, initial condition |
| Electrical state | Actual terminal voltages/currents, gate drive, pulse history and polarity |
| Thermal state | Junction-temperature method, case/coolant temperature, mounting and soak time |
| Measurement chain | Instrument/probe identifiers, bandwidth, calibration, deskew and fixture revision |
| Extraction | Raw files, integration windows, filtering, offsets, model equation and software revision |
| Evidence | Repeated points, multiple samples, uncertainty and anomaly/failure classification |
Define stopping limits from the selected device and fixture. High-energy and fault tests need containment, interlocks and a verified discharge/protection sequence. Commission instruments and timing at reduced energy before approaching the intended test envelope.
6. Turn measurements into models without losing their conditions
A first converter loss model combines conduction and switching terms:
\[P_{\mathrm{cond}}=\frac1T\int_0^T v_{\mathrm{on}}(t)i(t)\,dt, \qquad P_{\mathrm{sw}}=f_s\sum_{r\in\text{events per cycle}}E_r. \tag{2}\]For switching energies, record what the integration includes. Adding separate recovery or output-capacitance loss to an energy map that already includes it can count the same energy twice.
For a linear thermal model with a fixed reference boundary,
\[T_j(t)-T_{\mathrm{ref}}=\int_0^t h_{\mathrm{th}}(t-\tau)P_{\mathrm{loss}}(\tau)\,d\tau, \qquad h_{\mathrm{th}}=\frac{dZ_{\mathrm{th}}}{dt}. \tag{3}\]Temperature then feeds back into conduction and switching loss. Solve this electrical–thermal interaction consistently. A thermal model fitted near one temperature may need refinement when material properties or cooling change substantially.
Export static curves to an appropriate circuit model, switching-energy maps to system loss calculations, and thermal networks to transient temperature calculations. A PLECS energy table does not predict switching-node ringing; a detailed SPICE model is not automatically a reliable ageing model. Reserve operating points and waveforms not used in fitting for validation.
7. Learn in a sequence that makes errors visible
Begin with Kelvin resistance and low-energy static tests. Calibrate junction-temperature sensing next. Then study DPT, charge/capacitance and thermal transients. These baselines support later ageing tests, where a measured change must be distinguished from temperature error, contact drift or probe changes.
Only after the stress histories and failure evidence are understood should they be used in a mission-profile lifetime calculation. The goal is a traceable chain from experiment to model to design decision, with uncertainty carried through each step.